
H2 2026 Market Commentary: An Investment-Led Upturn, Seen First in Freight

Key Takeaways
The Signal: Freight is inflecting after the 2022–2025 freight recession: Cass freight expenditures rose 7.5% year-over-year as of May 2026 after falling 19% in 2023 and 11% in 2024, and Hudson Hill’s freight businesses are seeing price and volume rise together — a solid early-cycle signal. Freight historically leads the broader economy by four to five months, and unlike 2019 and 2022–24, broad leading indicators are confirming.
The Driver: This expansion is investment-led, not consumer-led. In Q1 2026, business fixed investment contributed 1.42pp of GDP growth versus the consumer’s 0.37pp, with hyperscaler capital expenditures approaching $600 billion in 2026.
The Impact: The geography of freight demand is shifting: data-center corridors like Columbus/New Albany, Ohio are up 37% over two years, while consumer-driven lanes like Los Angeles/Inland Empire are down as much as 7%.
The Cycle: Investment-driven cycles tend to compound. The EIA projects the strongest four-year power-demand growth since 2000, with data centers rising from 4.4% of US electricity consumption to 7–12% by 2028 and primary-market vacancies at 1.4%.
The Caveats: The boom rests on unproven AI economics — industry revenue must exceed $2 trillion by 2030, up from roughly $45 billion today, with hyperscalers funding ~94% of operating cash flow. We still expect a self-reinforcing cycle and a broad step-up in activity into 2027.
The Signal
Hudson Hill’s business services companies touch a wide range of end markets, and in aggregate they give us an early read on where the economy is headed. Our transportation and logistics businesses, for example, facilitate economic activity that shows up in national accounts 6-12 months later.
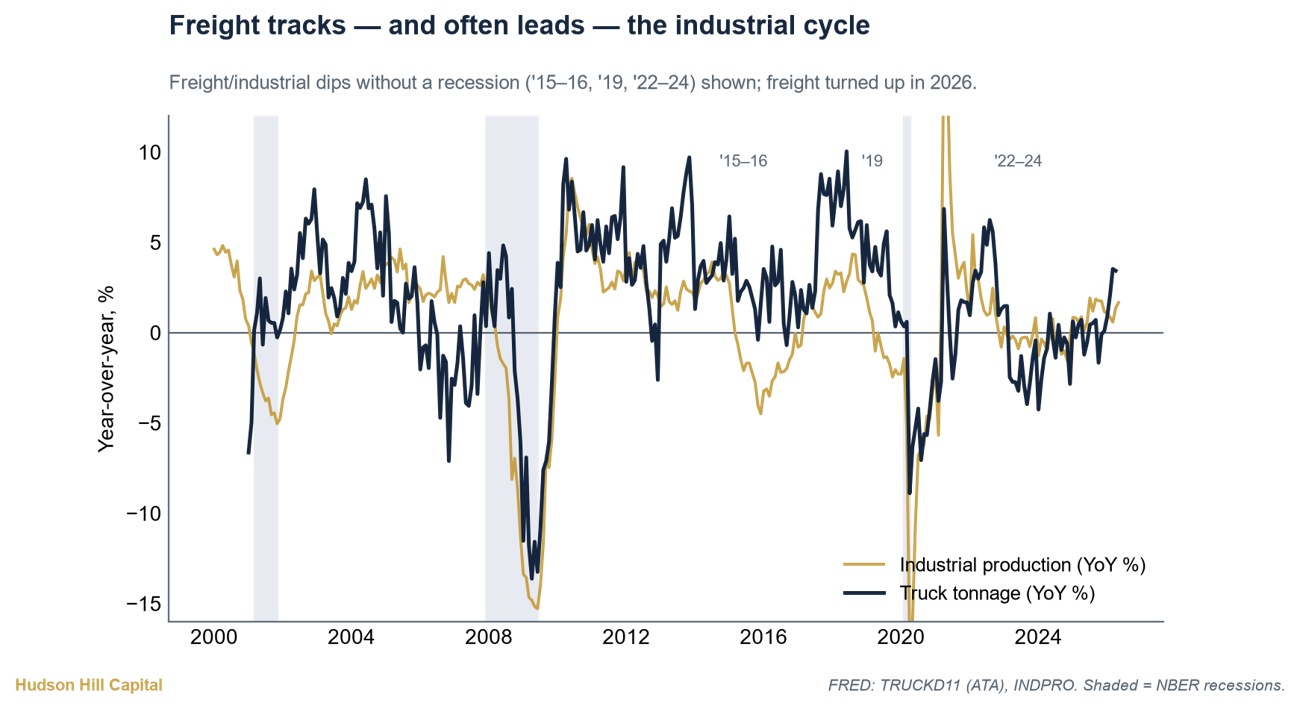
Figure 1. Truck tonnage vs. industrial production, YoY % (2000–2026, FRED) — freight tracks and often leads the industrial cycle; freight dipped without recession in '15–16, '19, and '22–24, and turned up in 2026.
GDP grew by ~2.5% in 2023-2024, but cycle-sensitive businesses spent those years in decline, most visibly in a long and deep freight recession that ran from 2022 to 2025. Much of that growth was borrowed. The federal deficit was 6% of GDP, well above the 3.7% norm, while the income side of the economy (GDI) grew by less than 1% even as spending-side GDP appeared strong. Hiring tied to government spending (government itself, healthcare, and education) supplied 80% of 2024’s job gains, while temporary-help staffing fell 20% from its peak.
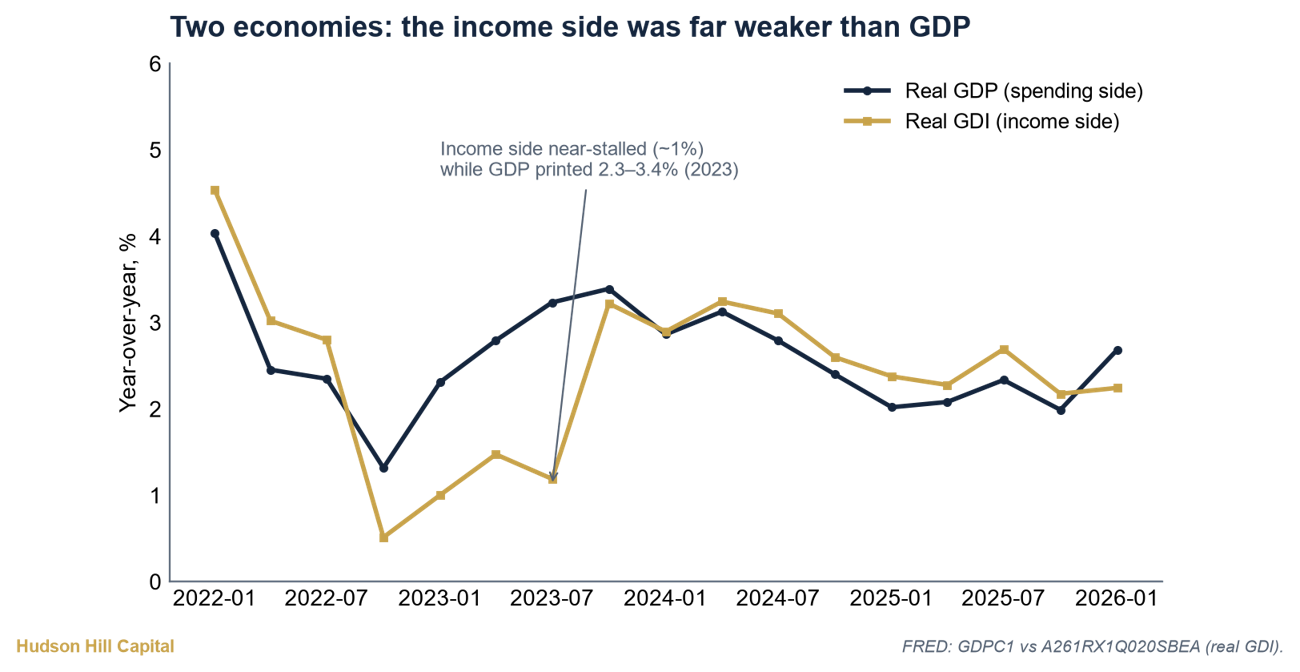
Figure 2. Real GDP vs. real GDI, YoY % (2022–2026, FRED) — the income side near-stalled (~1%) in 2023 while spending-side GDP printed 2.3–3.4%.
Early data from our portfolio companies point to a much stronger economy in 2026 and into 2027. Our freight brokerage businesses are seeing ~17% increases in revenue per load, while volumes are increasing in the mid-single digits. That price and volume are rising together is a solid early-cycle signal. Small- and mid-sized parcel shippers are seeing activity accelerate even faster, with revenues up 30%+ YTD 2026.
Industry-wide data tells the same story. According to the Cass Freight Index, expenditures grew 7.5% year-over-year as of May 2026, after falling 19% in 2023 and 11% in 2024. The Logistics Managers' Index hit 71.1, its highest since March 2022.
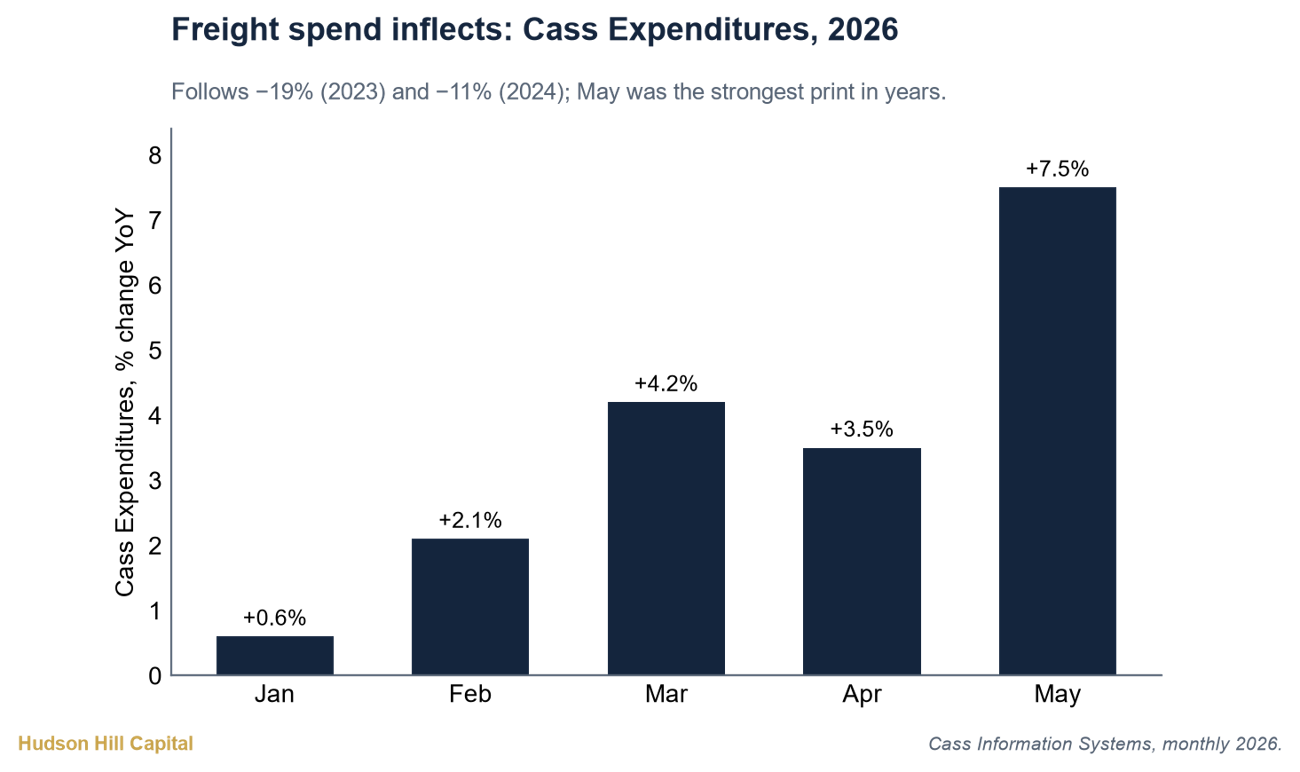
Figure 3. Cass freight expenditures, % change YoY (Jan–May 2026) — steady inflection from +0.6% in January to +7.5% in May, following −19% in 2023 and −11% in 2024.
The spot-to-contract spread, a vital barometer for market conditions, declined by ~70%, and Class 8 truck orders are up over 100% as fleets rebuild capacity gutted in 2023, when ~88,000 carriers exited, leaving the remaining supply far more sensitive to incremental demand.
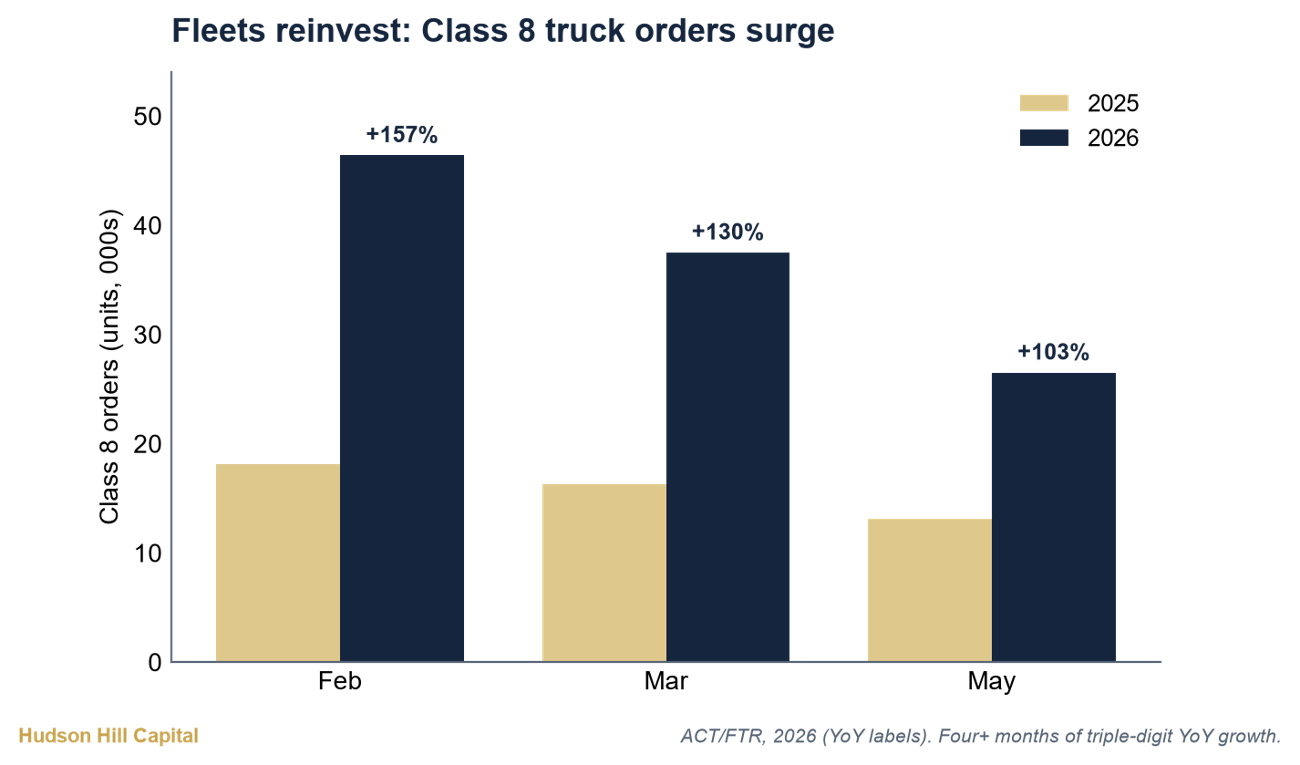
Figure 4. Class 8 truck orders, 2026 vs. 2025 (ACT/FTR) — triple-digit YoY growth in orders: +157% (Feb), +130% (Mar), +103% (May).
Historically, freight leads the broader economic cycle by four to five months at turning points, and the strength of this acceleration justifies broader economic bullishness well beyond our portfolio. Unlike freight’s false starts in 2019 and 2022-24, the broad leading indicators are confirming this time: ISM new orders, the Conference Board LEI, and an un-inverted yield curve are all rising.
The Driver: Investment, Not the Consumer, Is Leading This Expansion
Unlike past expansions, this one is driven by investment rather than by consumers. In Q1 2026, business fixed investment contributed 1.42pp of GDP growth against the consumer’s 0.37pp. Equipment and software spending tied to data centers and power infrastructure is doing most of the work. In 2024, CHIPS Act factory expansion drove new manufacturing construction. In 2025 and 2026, the baton passed to data centers, which grew +32% in 2025 and now exceed US office construction. This buildout is financed by private, cash-flowing enterprises rather than the government. Hyperscaler capital expenditures are approaching $600 billion in 2026 alone and will continue to impact these metrics.
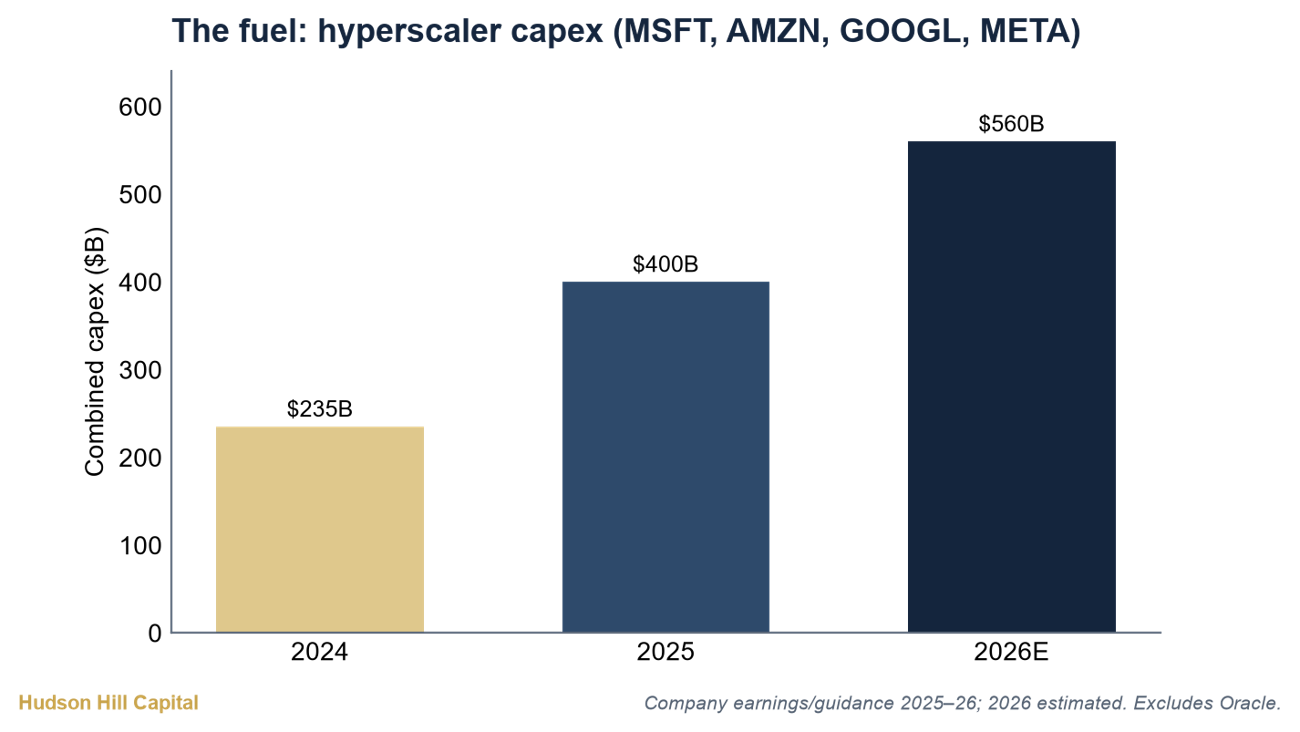
Figure 5. Combined hyperscaler capex — MSFT, AMZN, GOOGL, META, $B — $235B (2024), $400B (2025), ~$560B estimated (2026).
The Impact: Freight Demand Is Shifting Toward Data-Center Corridors
You can see the shift in the geography of freight demand. Costs are climbing the most in areas where data centers are being built: the Columbus/New Albany, Ohio corridor is up 37% over two years, and Richmond/Northern Virginia is up 10%+. Shipping lanes historically tied to consumer spending, such as Los Angeles/Inland Empire, are down by as much as 7%.
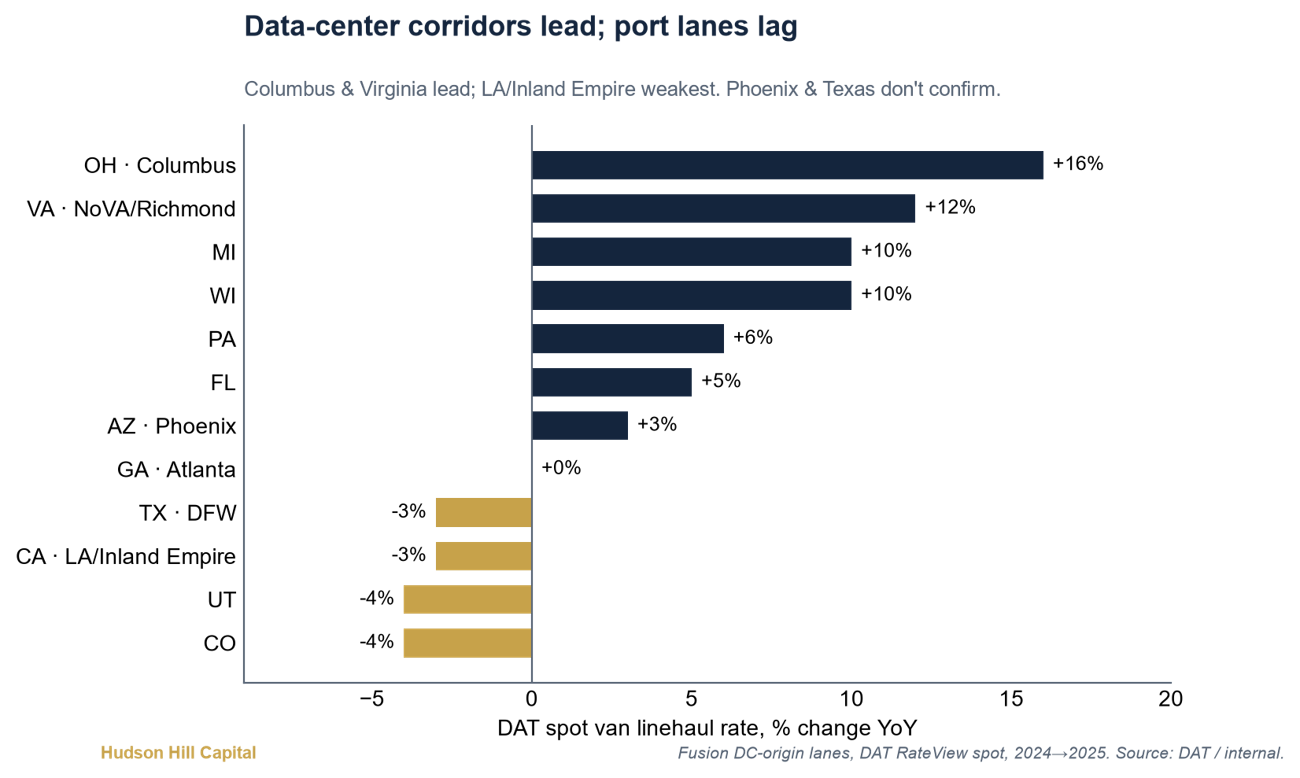
Figure 6. DAT spot van linehaul rates by market, % change YoY (2024→2025) — data-center corridors lead (Columbus +16%, NoVA/Richmond +12%) while consumer- and port-driven lanes lag (DFW and LA/Inland Empire −3%, UT and CO −4%).
The equipment mix points the same way. Flatbed load-to-truck ratios sit at an all-time high of 71:1, and the SONAR National Truckload Index just hit its own record of $3.83 per mile in early June 2026 (albeit partly driven by the spike in diesel costs caused by the Middle East conflict).
The Cycle: Why Investment-Led Growth Compounds Into 2027
Consumer-led expansions often revert to the mean. Investment-driven cycles tend to compound, which is the root of Hudson Hill’s broader economic optimism through 2026 and into 2027. Many of these investments are multi-year commitments and, once built, they generate a durable stream of follow-on activity from power to hardware refresh to services and logistics . After nearly two decades of flat U.S. power demand, the EIA now projects the strongest four-year growth since 2000, with data centers set to rise from 4.4% of US electricity consumption to 7–12% by 2028. Grid planners have raised five-year load forecasts roughly sixfold, and transformer lead times now run beyond two years. Even with all this construction, data center vacancies across primary markets sit at 1.4%, so capacity will continue to undershoot demand over the next 12 months.
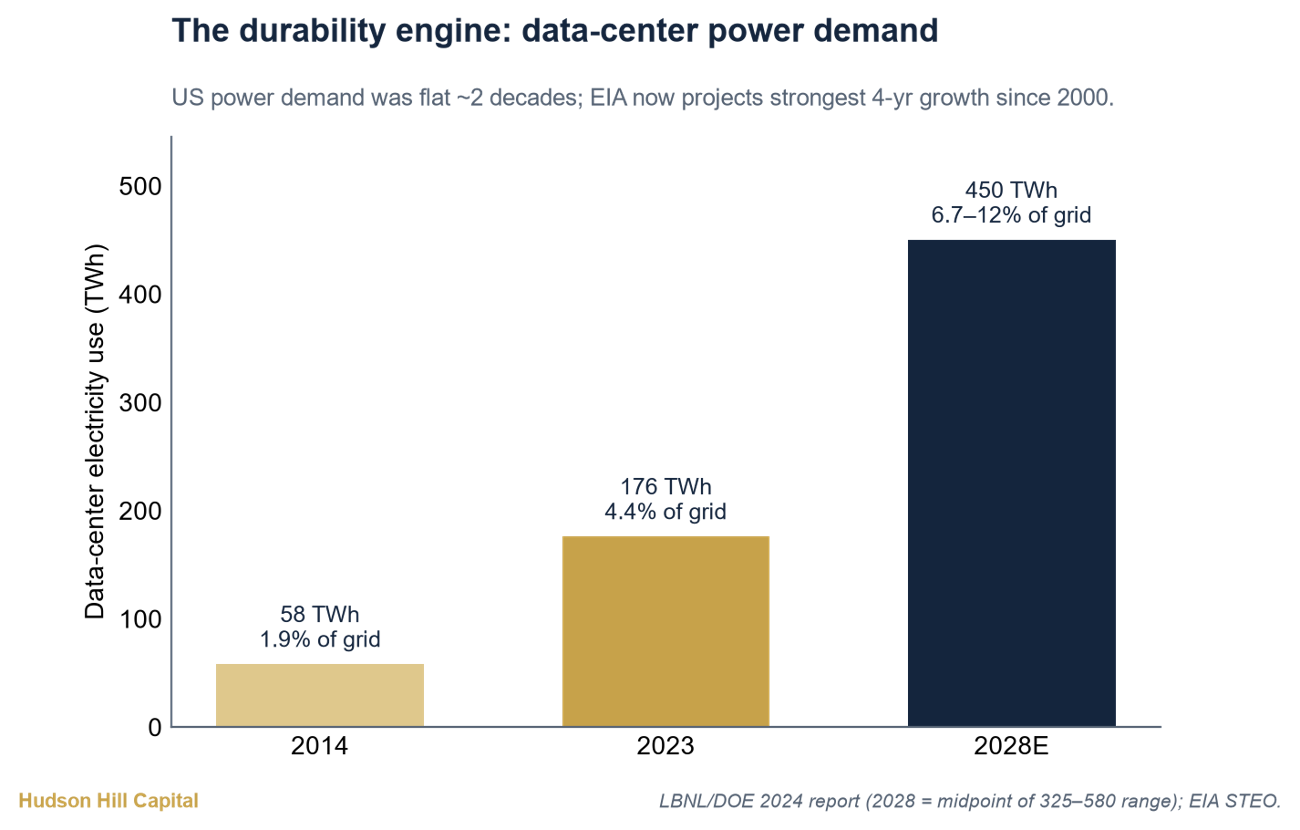
Figure 7. US data-center electricity use, TWh (LBNL/DOE, EIA) — 58 TWh (1.9% of grid) in 2014, 176 TWh (4.4%) in 2023, projected ~450 TWh (6.7–12% of grid) by 2028.
The Caveat: The Boom Rests on Unproven AI Economics
The obvious caveat: this boom rests on a technology, artificial intelligence, whose long-term economics remain unproven, if not questionable. To generate returns on the capital being invested, AI industry revenue needs to exceed $2 trillion by 2030, up from roughly $45 billion today. That growth must happen despite repeated reports that enterprise AI pilots deliver no measurable return, and with a handful of hyperscaler balance sheets funding nearly all of it, at ~94% of their operating cash flow.